AKSHAR
Browser Extension — Developer Tool2026Open Source
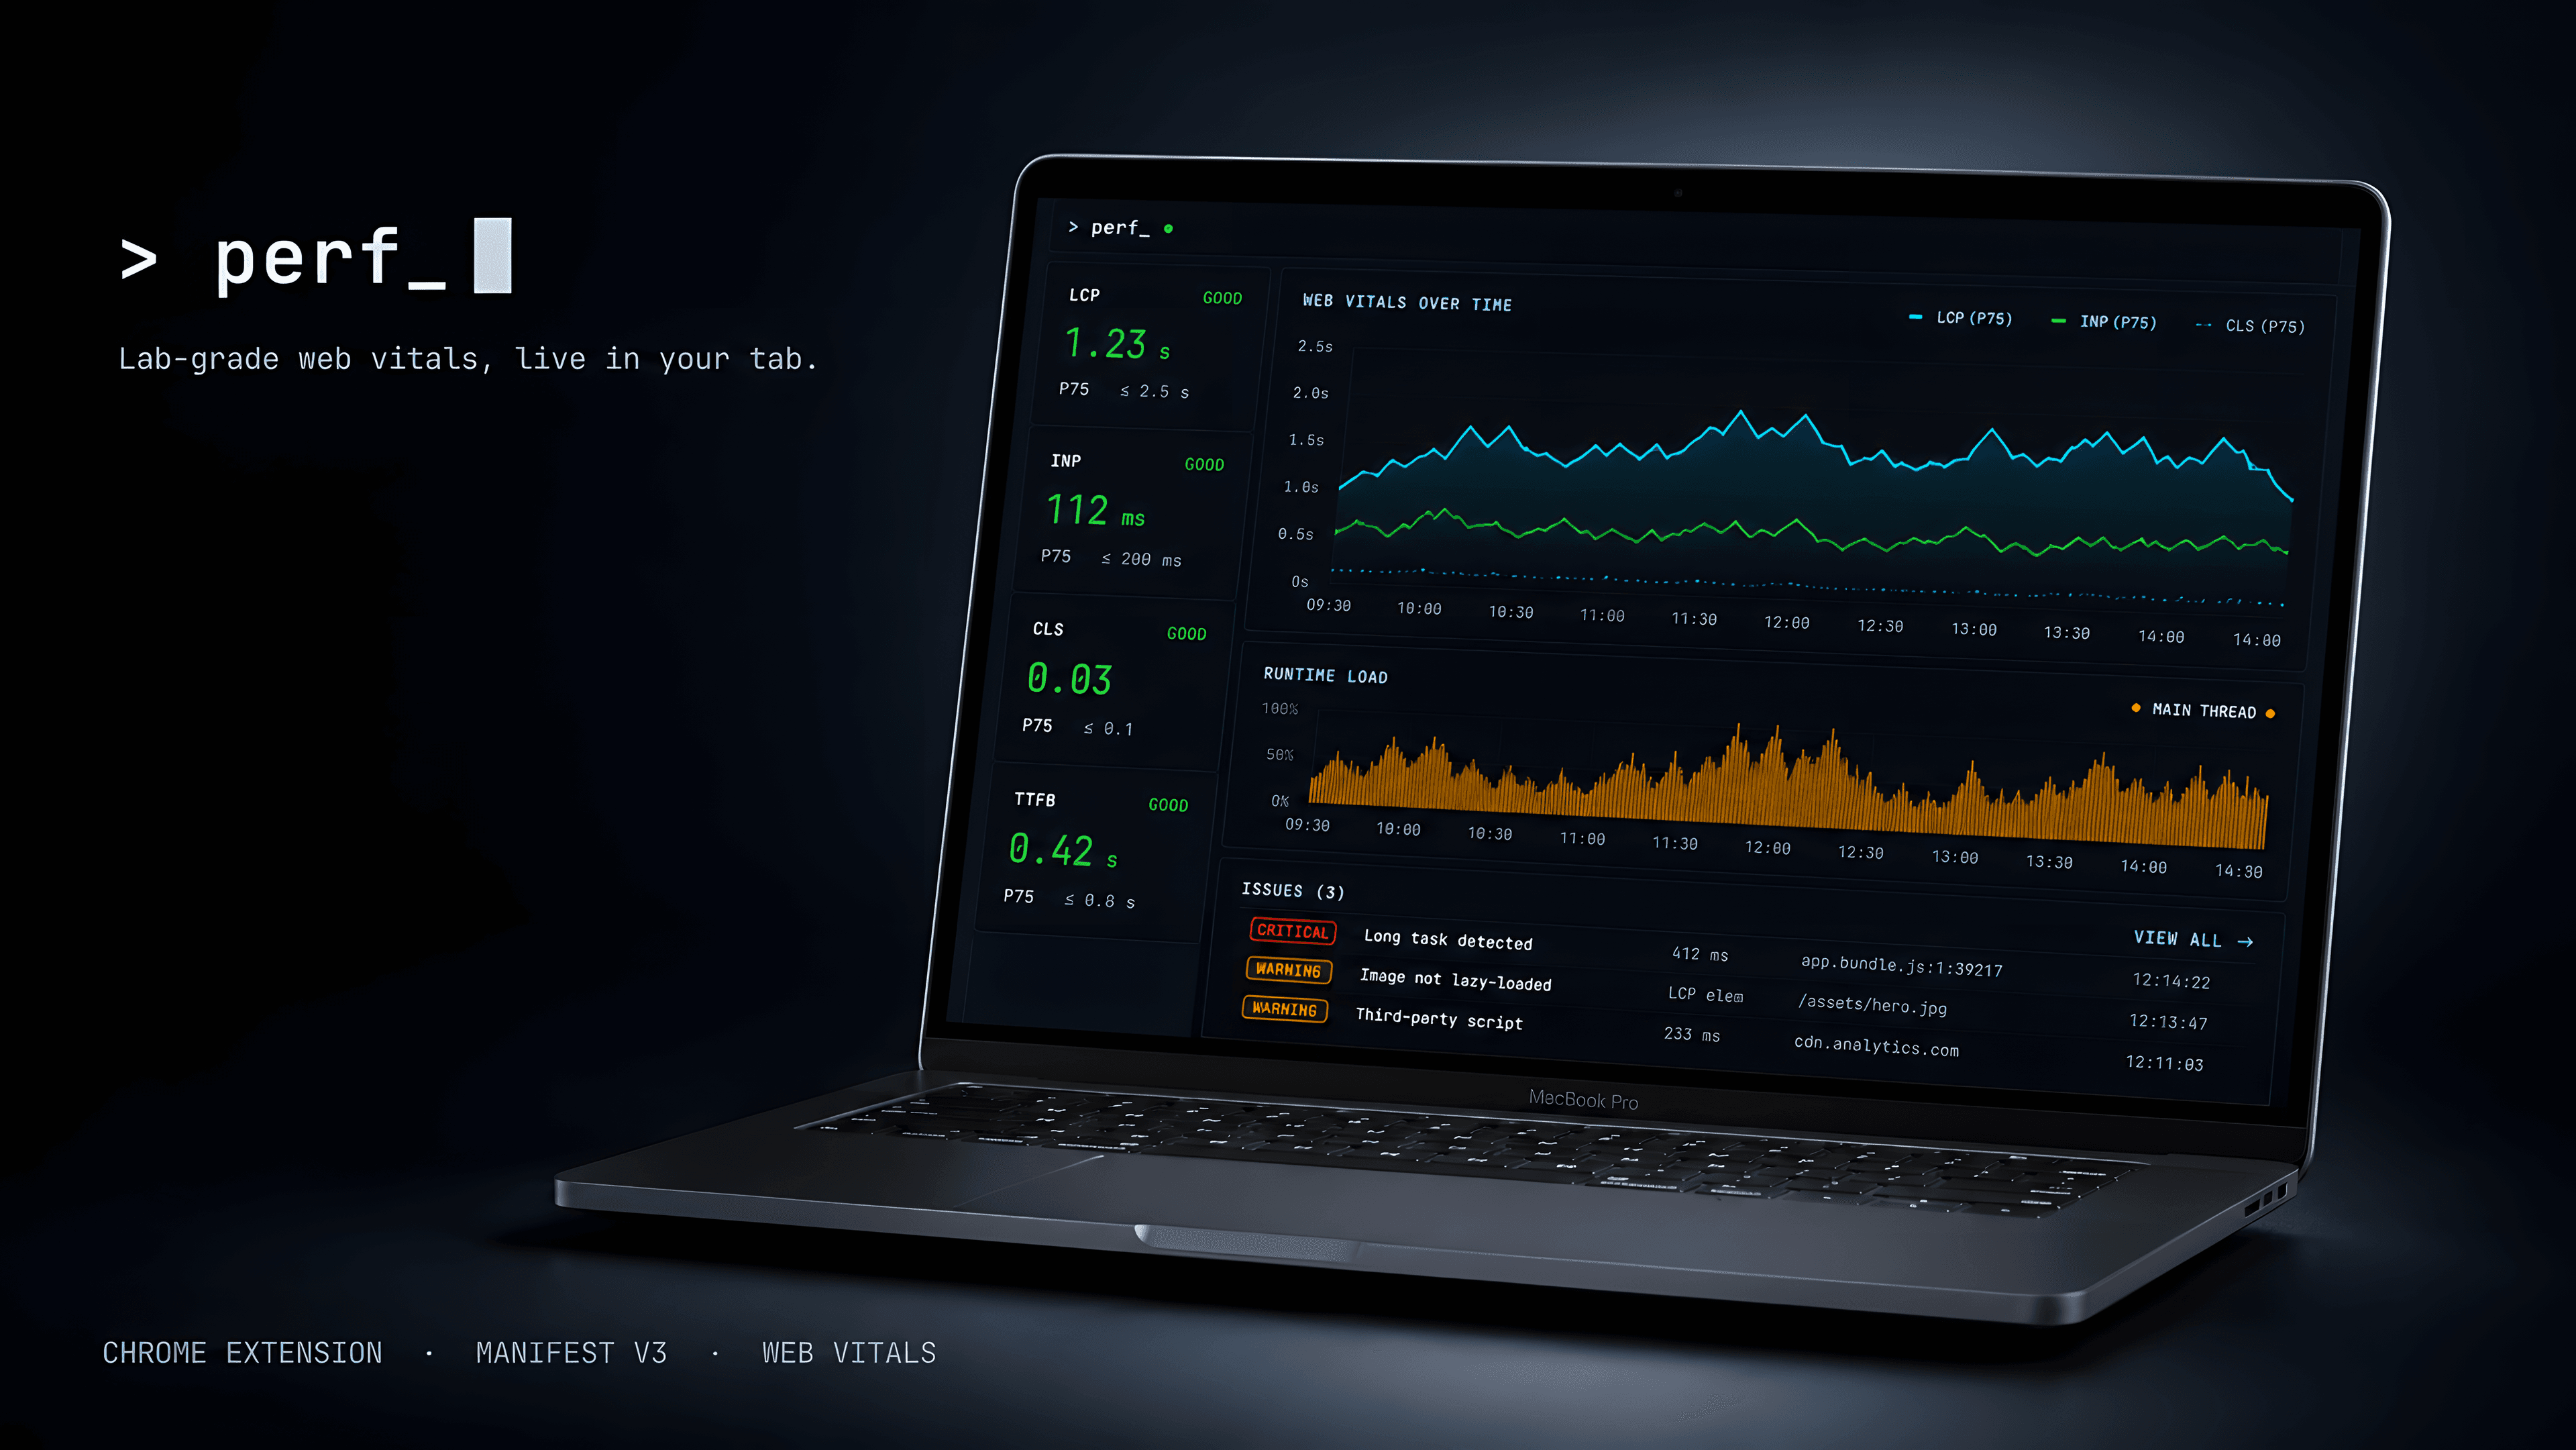
Chrome Perf Analyzer
A DevTools extension that captures Core Web Vitals and ranks performance issues by impact — without touching the page under test.
The Challenge
DevTools extensions operating under Manifest V3 lose their background page — replaced by a service worker that Chrome kills after 30 seconds of inactivity. For a performance recording tool, that means all captured metrics, timing data, and analysis state can vanish mid-session. The extension also needed to observe the inspected page without interfering with it: injecting globals or monkey-patching browser APIs would corrupt the very metrics it was trying to measure. And the analysis had to cross-correlate signals that Chrome normally siloes — network timing, JavaScript coverage, heap growth, long tasks, CWV observations — and rank them by actual impact rather than just reporting raw numbers.
The Approach
All session state is serialised to chrome.storage.session on every meaningful update and re-hydrated via a SESSION_HYDRATE message when the panel reconnects after a service worker restart. A chrome.alarms keepalive fires during active recordings to prevent premature termination. Data collection runs entirely over Chrome DevTools Protocol — the same wire protocol Chrome uses internally — so no globals are injected and the page under test runs unmodified. The analysis engine cross-correlates CDP domains (Network, Runtime, Coverage, Performance, Tracing) into a unified issue list, then ranks each finding using a tiered penalty system: CRITICAL issues (long tasks >50ms, single bundle >200 KB, coverage <30%, testing library in prod) dock 18 points; WARNINGs dock 8; INFOs dock 2. Every issue includes a concrete recommendation and byte-savings estimate. Library fingerprinting uses a three-tier strategy that starts with free URL-pattern matching before escalating to source content scanning and Runtime.evaluate global probing — minimising overhead while maximising detection coverage across 54 known packages.
What was built
- Core Web Vitals capture: LCP, CLS, INP, FCP, TTFB via CDP + PerformanceObserver
- Performance score engine (0–100) with CRITICAL / WARNING / INFO penalty tiers
- Library fingerprinting across 54 known packages using a three-tier detection strategy
- Network waterfall renderer with named timing phases and P75/P95/P99 percentiles
- Long task detection tracking JavaScript blocking tasks >50ms
- Coverage analysis with dead code percentage and byte-savings estimates
- Four canvas visualizations: timeline, runtime heap, paint health, multi-metric radar
Deliverables
- Chrome MV3 DevTools extension adding a dedicated ⚡ Perf panel to the browser's native DevTools
- Service worker state persistence via chrome.storage.session + SESSION_HYDRATE messages on PANEL_READY — survives the 30s MV3 SW sleep kill without losing session data
- chrome.alarms keepalive preventing premature service worker termination during active recordings
- 14-type discriminated-union message contract across 4 isolated contexts (service worker, devtools page, panel, content script) — no stringly-typed postMessage calls
- Four isolated Webpack 5 entry bundles (splitChunks: false) — each context gets an independent, minimal bundle with zero cross-contamination
- Library fingerprinting engine identifying 54 frameworks, UI libraries, utilities, and state managers via three-tier strategy: URL pattern matching (free), 8 KB source content scan, and Runtime.evaluate global probing
- Bundler detection covering webpack, Vite, Rollup, Parcel, esbuild, and Turbopack via code signatures
- CRITICAL issue auto-flag for testing libraries (Jest, Mocha, Cypress) detected in production bundles
- Network timing breakdown converting raw CDP offsets to named phases: blocked, DNS, connect, SSL, send, TTFB, receive — with P75/P95/P99 percentile aggregation
- Coverage analysis parsing transfer vs. parsed size; coverage below 30% triggers a CRITICAL penalty
- Performance score: starts at 100, CRITICAL issues dock −18 points, WARNINGs −8, INFOs −2, floor at 0
- 55+ passing tests via ts-jest with TypeScript strict; zero runtime dependencies
The Outcome
Chrome Perf Analyzer ships as a production-quality DevTools extension with the full analysis pipeline working end-to-end: CDP connection, CWV capture, library fingerprinting, network waterfall, coverage analysis, long task tracking, and a ranked issue list with a 0–100 performance score. The panel handles service worker restarts transparently — sessions survive without data loss. The extension carries zero runtime dependencies, passes 55+ typed tests, and operates without touching the inspected page. It turns what is normally a four-tab manual investigation into a single panel with actionable, ranked output.
Results
54Libraries fingerprinted (3-tier detection)
14Typed message contract types across 4 contexts
55+Tests passing (TypeScript strict)
0Runtime dependencies
Built with
Chrome MV3TypeScript 5.4Chrome DevTools ProtocolWebpack 5ts-jestCanvas API
